To illustrate the usefulness of forthcoming more accurate  data, we
determine here the low-energy constants
data, we
determine here the low-energy constants  and
and  from data on
  decays and on
  threshold parameters, using the
improved S-wave amplitude f set up above.
For a comparison with earlier work [55] we refer the reader
to Ref. [62].
threshold parameters, using the
improved S-wave amplitude f set up above.
For a comparison with earlier work [55] we refer the reader
to Ref. [62].
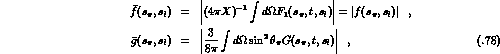
We perform fits
to  as given in (5.37) and to
the
as given in (5.37) and to
the  threshold
parameters listed in table 5.2. We introduce for this purpose the
quantities
threshold
parameters listed in table 5.2. We introduce for this purpose the
quantities
where the factor  appears because G is expanded
in derivatives of Legendre polynomials.
Below, we identify [
appears because G is expanded
in derivatives of Legendre polynomials.
Below, we identify [ ,
,  ] with [
 ,
,
 ], which depend on
  . Furthermore, we compare
the slope
. Furthermore, we compare
the slope  with
with

which depends on both  and
and  . We use these dependences to
estimate systematic uncertainties in the determination of the low-energy
couplings. [In future high-statistics experiments, the
. We use these dependences to
estimate systematic uncertainties in the determination of the low-energy
couplings. [In future high-statistics experiments, the  -dependence of the
form factors will presumably be resolved. It will be easy to adapt the
procedure to this case.]
-dependence of the
form factors will presumably be resolved. It will be easy to adapt the
procedure to this case.]
We have used MINUIT [70] to perform the fits. The results for the
choice  are given in table 5.2.
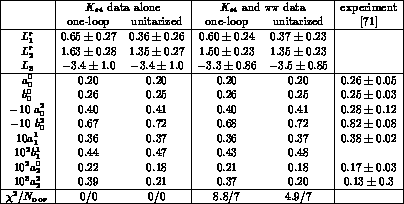
Table 5.2:
Results of fits with one-loop and unitarized form factors, respectively. The
errors quoted for the  's are statistical only. The
  are given in
units of
are given in
units of  at the scale
  , the scattering lengths
  and the slopes
  in appropriate powers of
  .
.
In the columns denoted by ``one-loop", we have evaluated  and
and
 from the one-loop representation given above
![]() .
In the fit with the unitarized form
factor (columns 3 and 5), we have evaluated
.
In the fit with the unitarized form
factor (columns 3 and 5), we have evaluated  from
Eqs. (5.76), inserting in the Omnès function the
parametrization of the
from
Eqs. (5.76), inserting in the Omnès function the
parametrization of the  S-wave phase shift proposed by Schenk
[72, solution B,]. For the form factor G,
we have again used the one-loop representation.
The statistical errors
quoted for the
S-wave phase shift proposed by Schenk
[72, solution B,]. For the form factor G,
we have again used the one-loop representation.
The statistical errors
quoted for the  's are the ones generated by the procedure MINOS in MINUIT
and correspond to an increase of
's are the ones generated by the procedure MINOS in MINUIT
and correspond to an increase of  by one unit.
A few remarks are in order at this place.
 scattering data is better using
the unitarized form factors, in particular so for
the D-wave scattering lengths.
scattering data is better using
the unitarized form factors, in particular so for
the D-wave scattering lengths.
 's in
column 4 and 5 are apparently consistent with each other within one error bar,
the
's in
column 4 and 5 are apparently consistent with each other within one error bar,
the  in column 5 increases from 4.9 to 30.7 if
the
in column 5 increases from 4.9 to 30.7 if
the  's from column 4 are used in the evaluation of
  in
column 5. (For a discussion about the interpretation of the errors see
[70]).
in
column 5. (For a discussion about the interpretation of the errors see
[70]).
 which occur in
  analyses may be evaluated from a given set of
  and
and  [44]. Their value changes in a significant way by
using the unitarized amplitude instead of the one-loop formulae: the
values for
[44]. Their value changes in a significant way by
using the unitarized amplitude instead of the one-loop formulae: the
values for  in column 4 and 5 are
 and
and  , respectively.
 and
and  are related to
  phase shifts through sum rules [73,74]. In principle, one
could
take these constraints into account as well
phase shifts through sum rules [73,74]. In principle, one
could
take these constraints into account as well cross sections which occur in those relations.
The statistical error in the data is only one source of the uncertainty in the low-energy constants, which are in addition affected by the ambiguities in the estimate of the higher-order corrections. These systematic uncertainties have several sources:
 have not been taken into account.
 and
and  depend on
  , and
, and  is a
function of both
is a
function of both  and
and  .
.
 phase shift and on the cutoff
  used.
used.
We have considered carefully these effects [62], and found that the best
determination of  , and
, and  which takes them into
account is
which takes them into
account is
These values are the ones quoted in table 1 in Ref. [2].
For  analyses it is useful to know the corresponding
values for the constants
analyses it is useful to know the corresponding
values for the constants  and
and  ,
,
The value and uncertainties in these couplings play a decisive role in a
planned experiment [75] to measure the lifetime of  atoms,
which will provide a completely independent measurement of the
atoms,
which will provide a completely independent measurement of the  scattering lengths
  .
.
One motivation for the analysis in [54,55] was to test the
large- prediction
  . The above result shows that a small non-zero
value is preferred.
To obtain a clean error analysis, we have repeated the fitting
procedure using the variables
. The above result shows that a small non-zero
value is preferred.
To obtain a clean error analysis, we have repeated the fitting
procedure using the variables
We
performed a fit to  and
and  data, including the theoretical error
in G as discussed above, and found
data, including the theoretical error
in G as discussed above, and found
The result is that the large- prediction works remarkably well.