

Next: 5.10 Improvements at DANE
Up: 5 decays
Previous: 5.8 Determination of and
In this section we make several predictions using the  's from
table 1 in Ref. [2].
It is clear that new and more accurate data on
 will allow for a better determination of
  and
and  ,
and may correspondingly modify our predictions. However, unless a
dramatic change in the values of these constants occurs, the
modified predictions will be within the errors that we give.
Whereas the slope  was assumed to coincide
with the slope
  in the final analysis of the data in Ref.
[53], these two quantities may differ in the chiral representation.
Furthermore, our amplitudes allow us to evaluate partial and total decay
rates. In this section, we consider the slope
  and the total rates.

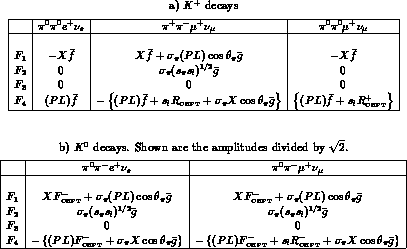
Table 5.3:
Approximations used to evaluate the total rates
in table 5.4. Use of
 ,
,
 reproduces the one-loop results in table 5.4 to about
  .
.

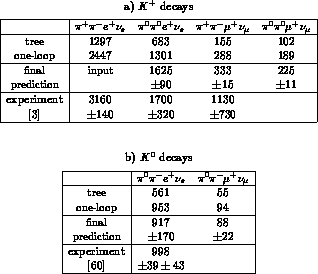
Table 5.4:
Total decay rates in sec . To evaluate the rates at one-loop accuracy,
we have used the
  's from table 1 in Ref. [2].
The final predictions
are evaluated with the amplitudes shown in table 5.3, using
 . For the evaluation of the
uncertainties in the
rates see text.
The slope 
We consider the form factor  introduced in (5.78) and
determine its slope


from the one-loop expression for G. The result is
 . As the slope is a one-loop effect,
higher-order corrections may affect its value substantially. For this reason,
we have evaluated
  also from the modified form factor obtained by using the complete
resonance propagators (and the corresponding
  's), see Ref. [62].
The change is
  . We believe this to be a generous error
estimate and obtain in this manner

The central value indeed agrees with the slope  in (5.37).
Total rates
Once the leading partial waves  and
and  are known from e.g.
 decays, the chiral representation allows
one to predict the remaining rates within rather small uncertainties. We
illustrate the procedure for
  .
According to Eq. (5.24),
the relevant amplitude is determined by
 and
and  . The contribution from H is kinematically
strongly suppressed and completely negligible in all total
rates, whereas the contribution from R is
negligible in the electron modes. Using the chiral representation
of the amplitudes
  and
and  , we find that the rate is
reproduced to about 1%,
if one neglects
  altogether and uses only the leading partial wave
in
the remaining amplitude,
  . From the measured [53]
form factor
  we then find
  sec
sec . Finally, we estimate the error from

where  .
The final result for the rate is shown in the row ``final prediction" in
table 5.4, where we have also listed the tree and the
one-loop result, together
with the experimental data. The evaluation of the remaining rates is done in a
similar manner -- see table 5.3 for the simplifications used
and table 5.4 for the
corresponding predictions.
We have assessed an uncertainty due to contributions
from
 in the following manner.
i) We have checked that the results barely change by using the tree level
expression for
  instead of its one-loop representation. We
conclude
from this that the uncertainties in
  do not matter. ii) The
uncertainty from
  is taken into account by adding to
  in quadrature the
change obtained
by evaluating
  at
at  . iii) In
  decays,
we have also added in quadrature the difference generated by evaluating the
rate with
  MeV.
MeV.
The decay  has recently been
measured [60] with considerably higher statistics than before [3].
We display the result for the rate in the first column of table
5.4b.
The quoted errors correspond to the errors in the branching
ratio [60] and do not include the uncertainty in the total
decay rate quoted by the PDG [3].
Notice that the value for
  determined in [60] should be multiplied
with -1 [76].


Next: 5.10 Improvements at DANE
Up: 5 decays
Previous: 5.8 Determination of and
Carlos E.Piedrafita
 's from
table 1 in Ref. [2].
It is clear that new and more accurate data on
 will allow for a better determination of
  and
and  ,
and may correspondingly modify our predictions. However, unless a
dramatic change in the values of these constants occurs, the
modified predictions will be within the errors that we give.
 was assumed to coincide
with the slope
  in the final analysis of the data in Ref.
[
 and the total rates.

 ,
,
 reproduces the one-loop results in table
  .
.
 . To evaluate the rates at one-loop accuracy,
we have used the
  's from table 1 in Ref. [
 . For the evaluation of the
uncertainties in the
rates see text.
 introduced in (

 . As the slope is a one-loop effect,
higher-order corrections may affect its value substantially. For this reason,
we have evaluated
  also from the modified form factor obtained by using the complete
resonance propagators (and the corresponding
  's), see Ref. [
 . We believe this to be a generous error
estimate and obtain in this manner

 in (
in ( and
and  are known from e.g.
 decays, the chiral representation allows
one to predict the remaining rates within rather small uncertainties. We
illustrate the procedure for
  .
According to Eq. (
 and
and  . The contribution from H is kinematically
strongly suppressed and completely negligible in all total
rates, whereas the contribution from R is
negligible in the electron modes. Using the chiral representation
of the amplitudes
  and
and  , we find that the rate is
reproduced to about 1%,
if one neglects
  altogether and uses only the leading partial wave
in
the remaining amplitude,
  . From the measured [
 we then find
  sec
sec . Finally, we estimate the error from

 .
The final result for the rate is shown in the row ``final prediction" in
table
  in the following manner.
i) We have checked that the results barely change by using the tree level
expression for
  instead of its one-loop representation. We
conclude
from this that the uncertainties in
  do not matter. ii) The
uncertainty from
  is taken into account by adding to
  in quadrature the
change obtained
by evaluating
  at
at  . iii) In
  decays,
we have also added in quadrature the difference generated by evaluating the
rate with
  MeV.
MeV.
 has recently been
measured [
 determined in [