A brief description of ROG DATA
The Detectors
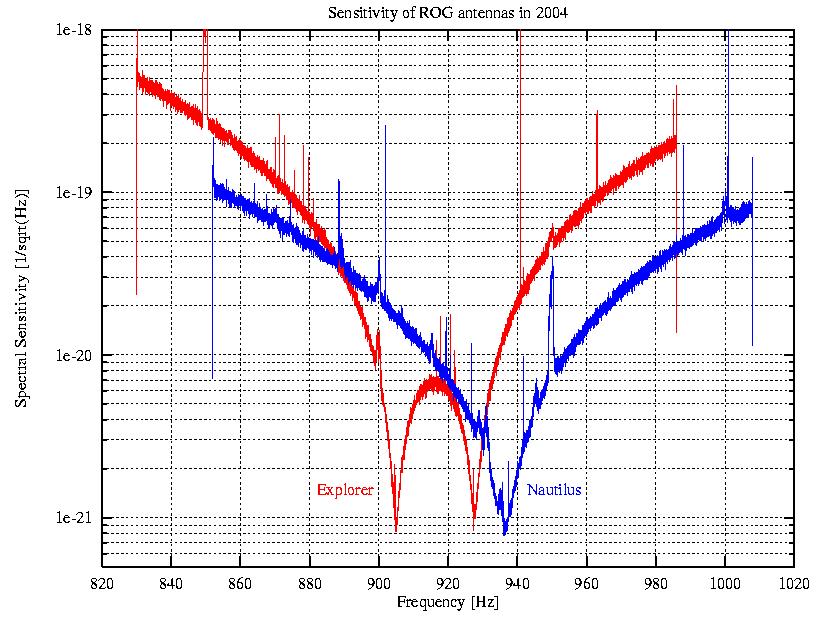
The ROG groups operates two Gravitational Wave (GW) detectors :
Explorer (at CERN-Geneva) and Nautilus
(at LNF-Frascati).
They both consist of a 3 m long Aluminum bar, suspended in
vacuum in a cryogenic environment. The amplitude of vibration
of the first longitudinal elastic mode of the cylinder, resonating
around 900 Hz, is the quantity monitored and analyzed in search of
an event generated by GW.
The bar vibration is converted into an electric signal by means
of a resonant transducer, constituting a capacitor
with a very small gap (12 &mu m or less).
The output of the transducer is first amplified by
a d.c. SQUID device, then by other more standard electronics and
finally sampled by an ADC at 5 kHz sampling frequency.
In order to reduce the thermal noise, both antennas are cooled
down to about 3 K. A suitable suspension and isolation system
is used to suppress the transmission of seismic noise from the
ground to the antennas.
Typical spectral sensitivity curves of the antennas can be seen
here.
Analysis of the Data
The more standard type of analysis performed is aimed to
detect short (few milliseconds) impulsive excitation.
The continuous data stream produced by the sampling ADC is acquired
by a VME real-time CPU, transferred to a computer and stored on
disks. The analysis code first performs a reduction of
the 5 kHz data by selecting a frequency band, about 160 Hz wide,
around the sensitive region in the FFT of the data. The spectrum is
then shifted down, so as to start from zero, and finally an inverse
FFT is performed, thus obtaining a time sequence at 3.2 ms sampling
time. To these data (called RAW data) is then applied a filter
optimally matched to the response to a delta-like excitation of
the bar, thus producing the so-called filtered data
(the FIL files we make available).
Searching for Events
The amplitude of the data in the filtered stream has a nearly
Gaussian distribution. Searching for candidate events
is done looking for values of the amplitude high with respect to
the sigma of the data themselves. A threshold is set, usually in
terms of critical ratio defined as
CR = (|x|- avg(|x|)/&sigma(|x|). An event is thus defined by the
time and amplitude of the local maximum is the data over threshold.
A dead time needs to be defined, as a minimum separation
between adjacent events (usually 1 second).
Starting from 2005, the search for events is performed on the
filtered data streams at 5 kHz sampling time. This allows a
better definition both of the amplitude and of the time of the
events.