Work in Progress

Achievements


1. Drift Chambers
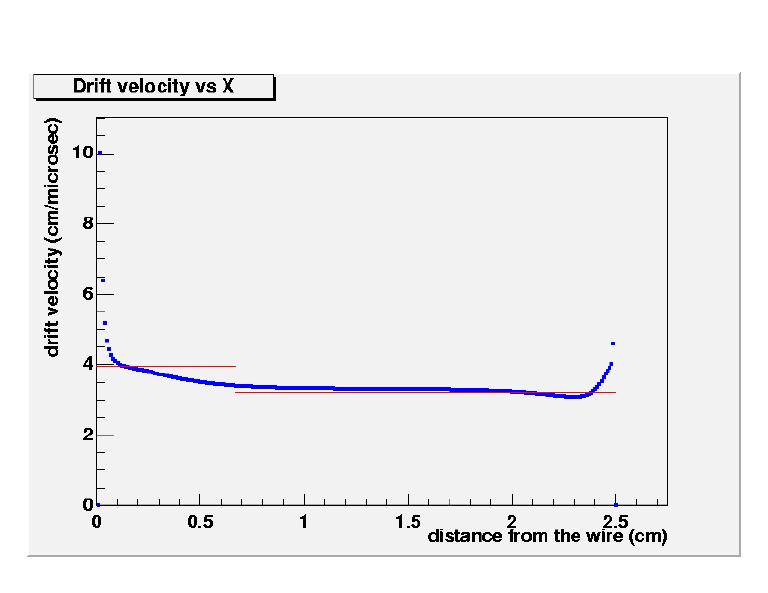
Alberto Panzarasa and Aldo Zenoni are studying the resolution of the drift chambers (DCH1 and DCH2) using cosmic ray data. Initial studies with a simple constant velocity model gave very large residues (of the order of 300 microns). Anomalous drift time spectra, and the fact that the mean value of the residues for even and odd wires were staggered, suggested that the drift velocity is not constant throughout the cell. A second rough model of the cell was then implemented in which the drift velocity as a function of the distance from the wire is a step function with two constant velocities: approx. 39 cm/µs if the distance from the wire is smaller than 0.65 cm, and approx. 34 cm/µs if the distance is larger. The exact velocities and intervals vary slightly from chamber to chamber.
While this model gave better results, it became clear that a more realistic model was necessary. The cells were therefore modeled using GARFIELD. The following figure shows the drift velocity as a function of the distance from the wire obtained using GARFIELD (blue squares), compared to the "step velocity" used in the previous rough model (red line).
Postscript
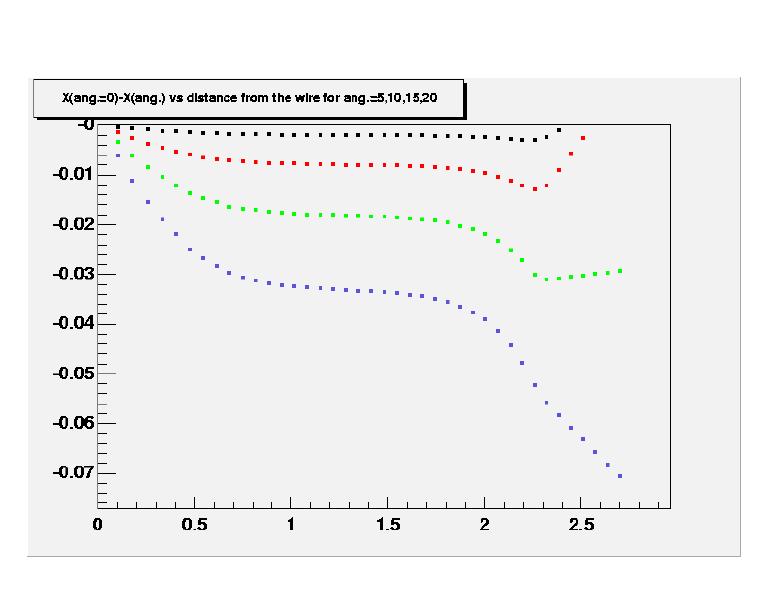
The residues of the DCHs decrease by about 100 microns when using GARFIELD to model the cells. The first GARFIELD model assumed that all cosmic rays were perpendicular to the chambers. Naturally, this is not a realistic assumption. The figure below shows the difference in drift distance (obtained using GARFIELD with inclined tracks) between a perpendicular track and a track with an angle of incidence of 5°, 10°, 15° and 20° (the colors agree with those from the figure). The y-axis is the difference in cm, and the x-axis is the distance from the wire in cm.
Postscript
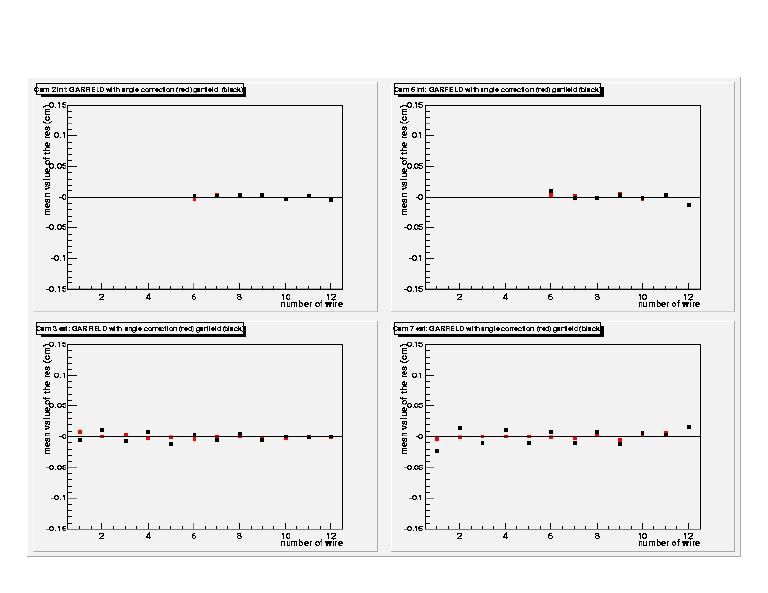
For angles of incidence of 15° or higher, the correction needed is larger than the expected resolution of the chambers, showing that a more complete model which takes into account the angle of incidence of the track is essential. Different tables of drift velocity as a function of the distance from the wire were generated using GARFIELD for different angles of incidence. The following figure shows the mean value of the DCH residues (in cm) for the different wires in each cell. The top plots are small chambers and the bottom plots are large chambers. The red squares are corrected for incidence angle, while the black squares are not.
Postscript
In the absence of systematic errors, the mean value of the residues should always be zero, while the width of the distribution is indicative of the resolution of the chambers.
The residues obtained with the step velocity model, GARFIELD, and GARFIELD + angular correction for different cells are shown in the following postscript file:
The residue distributions have long non-Gaussian tails. Using the reconstruction event display, it appears that these tails are due to multiple scattering of the cosmic ray muons, mainly while crossing the central scintillator used for the trigger during data acquisition. There is an intrinsic systematic contribution to the width of the residue distribution due to multiple scattering in the data.
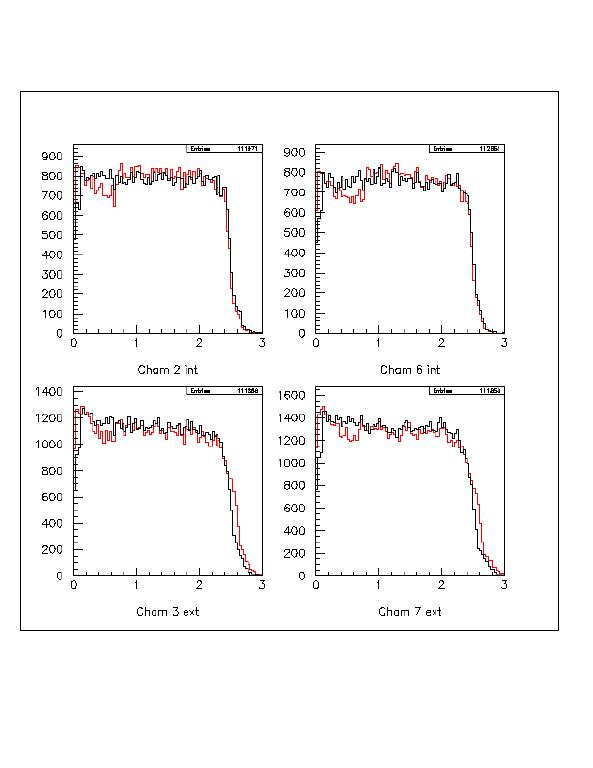
The following figure shows the crossing points on the plane of the sense wires. The red histogram corresponds to the step velocity model, and the black histogram to the GARFIELD + angular correction model.
Postscript
One expects a flat distribution except for possible inefficiencies very close to the sense wires and to the end of the cell, which is the case when using GARFIELD + angular corrections to model the cells.
2. Silicon µ-strips
We report the first cosmic ray reconstructed using the TOFINO and and Silicon µstrip detectors (ISIM and OSIM). Below is a graphical display of this landmark event. Just put your mouse on the figures and watch the reconstructed muon!
3. BHABHA reconstruction
The reconstruction program is now capable of doing the pattern recognition, track fitting, backtracking and vertex finding for bhabha (e+e-) events. The event display is capable of showing the results of BHABHA reconstruction in the xy and yz planes. Below are some examples. Put your mouse on the first two figures to see the MC event superimposed on the track-fitting results.
4. DCH Internal Report
A FINUDA Internal Report has been writen describing the resolution and alignment studies performed on the drift chambers. The abstract is:
We report on a cosmic ray test of the FINUDA drift chambers performed inside the FINUDA detector without a magnetic field. From an accurate study of the drift cell space-time relations we determine both the spatial resolution and the mechanical alignment of the chambers. The chambers operate with a non-saturated 70% He - 30% iC4H10 gas mixture and the drift cells are modeled using GARFIELD. After alignment of the drift chamber system, we find a spatial resolution averaged over the entire drift cell and over all angles of incidence of about 140 µm.
Complete report: Performances of the FINUDA Drift Chambers in a Cosmic Ray Test, LNF-00-030_R_.pdf
5. BHABHA Trigger Study
A preliminary study of the BHABHA trigger for FINUDA can be found in: Bhabha Trigger Study . This note describes different ITOF/ETOF trigger conditions, trigger acceptance for Bhabha events, and rejection for K+K-, KsKl and Touschek backgrounds. It also gives expected trigger rates for these processes assuming a luminosity of 1032 cm-2s-1.
6. Cosmic Ray Reconstruction inside a Magnetic Field
The new version 4.08/00 of the Monte Carlo and Reconstruction programs is able to reconstruct cosmic rays insude a magnetic field using the TOFONE, the STRAW tubes and the Drift Chambers. The figures below show a tipical Monte Carlo cosmic ray with the results of the track fitting superimposed.
Top STRAW Triplet:
Bottom STRAW Triplet:
One of the DCH hits:
The figure below shows the fit momentum and reconstructed mass distributions for Monte Carlo muons (µ-) with momentum 2 GeV/c which do not hit any heavy material (such as the one depicted above). The only active interaction mechanisms are energy loss and multiple scattering. Monte Carlo points and time of flights are NOT smeared, and therefore the resolution on the momentum and mass is due only to energy loss and multiple scattering effects. This is the best FINUDA could hope to do.
The fit momentum is lower than the MC momentum owing to an energy loss in the TOFONE and in the aluminum cylinder inside the TOFONE. This of course does not affect the mass calculation since the mass is reconstructed using the measured (fit) momentum. It should be noted that, at momentum 2 GeV/c, a muon (of mass 0.10566 GeV/c2) has a relativistic Beta factor of 0.9985, and in this regime a 1 mm change in reconstructed track length results in a 15 MeV/c2 mass change (Beta=P/E). Similarly, a very small error in the time of flight results in a large mass change. This means that calibration of the detector would only be feasible if very low energy muons are recorded. The smaller Beta is, the better the mass resolution will be, and it is not clear at all whether calibration using curved muons will be possible.
 alessandro.feliciello@to.infn.it